···python
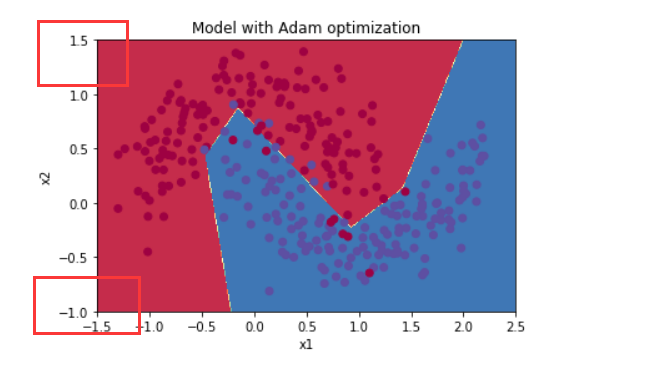
plt.title("Model with Adam optimization")
axes = plt.gca()
axes.set_xlim([-1.5,2.5])
axes.set_ylim([-1,1.5])
plot_decision_boundary(lambda x: predict_dec(parameters, x.T), train_X, train_Y)

![](https://img2020.cnblogs.com/blog/817161/202006/817161-20200611211706385-690784152.png)

相关文章:

  • 2021-11-06
  • 2021-05-31
  • 2021-07-12
  • 2022-12-23
  • 2022-01-01
  • 2022-02-10
  • 2021-10-05
  • 2021-05-28
猜你喜欢
  • 2022-12-23
  • 2021-12-15
  • 2022-12-23
  • 2021-11-15
  • 2021-05-25
  • 2021-06-07
相关资源
相似解决方案